


For a long time, attendance was considered the primary sign of success. If 700 employees registered and 650 attended, the event was deemed successful. But here’s the truth: attendance only tells you who turned up, not what they learned, how engaged they were, or if the training was effective or not.
In today’s business environment, where budgets are scrutinized and outcomes are more important than ever, learning and development executives require better, deeper, and more meaningful metrics to assess the effectiveness of their events.
In this blog, we will examine the top metrics for measuring L&D event success beyond attendance, explain why they are important, and more.
Why Attendance Is No Longer Enough to Measure L&D Event Success

Attendance is a surface-level metric. It simply answers one question i.e. did anyone log in? It does not solve much more essential questions, such as-
- Were the participants actively listening or multitasking?
- Did they get the content?
- Did they retain the information?
- Will they implement what they have learned at work?
- Did the event have any demonstrable benefits for the business?
In virtual contexts, this disparity is even more obvious. Someone can log in, mute the session and then walk away. In terms of attendance, they are considered participants. From a learning standpoint, nothing occurred.
This is why modern learning and development teams are turning away from vanity metrics (registrations, logins, and headcount) toward impact indicators that represent engagement, learning outcomes, behavioral change, and business benefits.
Aligning L&D Event Metrics With Clear Learning Goals
To measure an L&D event, it’s important to first understand why it exists.
Many learning programs fail not because the training was inadequate, but because the learning objectives were vague or disconnected from real needs. When goals are unclear, metrics become confused, disorganized, and frequently meaningless. Measuring achievement in the absence of set objectives is like asking for directions without knowing where you’re going.
Every learning and development event should strive to solve a specific problem or facilitate a stated outcome. For example-
- Improve your leadership communication skills.
- Reduce the onboarding time for new hires.
- Improve product expertise among sales teams.
- Develop confidence in using new tools or methods.
When learning objectives are clearly specified, measures become meaningful. Rather than assessing everything available, L&D teams measure what is truly important.
Clear goals help to answer-
- What should learners learn from this event?
- What will they be able to accomplish daily tasks differently?
- How will this training affect their daily work?
Learning objectives should not exist in isolation. They must be relevant to organizational priorities. For example-
- A leadership workshop should be aligned with retention or team engagement objectives.
- Sales training should be related to revenue or conversion KPIs.
- Compliance training should reduce errors and infractions.
When learning objectives coincide with business outcomes, L&D events are no longer viewed as cost centers, but rather as strategic investments.
To effectively connect metrics with learning objectives, consider three layers-
- The Learning Layer which measures participants’ knowledge, skills, and understanding.
- The Behavior Layer which assesses how participants apply their learning in real-world work circumstances.
- The Business Layer which assesses how behavior changes affect performance, productivity, and outcomes.
For example, suppose the purpose of an L&D event is to develop manager feedback skills-
- The learning metric here will be to understand feedback models.
- The behavior metric here will be the frequency and quality of feedback conversations.
- The business metric here will be the improved team engagement scores.
When metrics are linked in this way, each data point conveys a story rather than just a number.
Engagement Metrics: Measuring How Actively Trainees Participated

Engagement is one of the most reliable early predictors of learning achievement. While attendance identifies who logged in, engagement indicates who was mentally there and involved.
Engagement is especially important in virtual L&D sessions because distractions are only a click away. Someone may attend a session while multitasking, disengaging, or mentally checking out. Engagement metrics might help you see the difference.
Engagement is more than just clicking buttons. It reflects-
- Attention.
- Curiosity.
- Interaction.
- Cognitive effort.
Highly engaged learners are more likely to retain information, ask questions, think on concepts, and apply what they’ve learned later.
Here are some of the key engagement metrics to track-
1. Active Participation in Interactive Elements
Modern learning and development events rely largely on interactive features such as-
- Polls.
- Live Q&A.
- Chat conversations.
- Breakout rooms.
- Reactions and Emojis.
Tracking how many attendees actively use these features provides a more accurate picture of engagement. For example-
- If 80% of learners reply to polls, then engagement is high.
- If just 5% of the learners interact, the session may be excessively passive or misaligned with their needs.
Platforms like Airmeet are meant to foster these connections, making engagement easier to track in real time.
2. Quality of Engagement, Not Just Quantity
Engagement is more than just counting interactions. It is also important to consider the quality of involvement. For example-
- Are learners asking smart questions?
- Is the discussion significant or superficial?
- Are the participants sharing real-life experiences?
A small number of high-quality interactions can indicate deeper involvement than a large number of shallow responses.
3. Time Spent and Attention Retention
Another significant engagement statistic is how long learners remain actively engaged-
- Do they attend all sessions?
- When do the drop-offs occur?
- Do participants return after break?
If involvement reduces consistently at particular points, it could indicate-
- Content overload.
- Poor pace.
- Lack of significance.
Analyzing these patterns enables L&D teams to improve session structure and delivery.
Engagement metrics are a key predictor of learning achievement. While low engagement does not prove learning, it nearly always predicts poor learning outcomes. High engagement raises the chances that learners process information profoundly, learning seems relevant to them, and knowledge transfer occurs effectively.
Learning Outcome Metrics: Did Learning Actually Happen?
Learning outcome metrics prioritize knowledge acquisition, understanding and skill development over enjoyment or involvement.
1. Measuring Knowledge Gain
Pre-event & post-event assessments are among the most effective techniques to quantify learning. These may include-
- Short quizzes.
- Scenario-based questions.
- Practical exercises.
Comparing results before and after the event allows L&D teams to see-
- What learners already know.
- What new knowledge they acquired.
- Which areas still require strengthening.
When utilized consistently, even simple assessments can yield valuable insights.
2. Measuring Knowledge Retention Over Time
Learning that fades immediately has minimal utility. True success is defined by the ability to retain knowledge. Follow-up assessments undertaken weeks, or months after the event can assist measure-
- Long-term understanding.
- Recall important concepts.
- Ability to explain or apply learning independently.
Retention metrics are particularly useful for complex topics, or important skills that require long-term application.
3. Skill Development and Application Readiness
Not all learning outcomes can be measured using quizzes. For soft skills like leadership, communication and problem solving; application readiness becomes the most important metric.
Post-event questionnaires could ask learners the following questions-
- How confident do you feel about using this skill?
- How prepared are you to apply what you’ve learned in your current role?
- What circumstances will you use this knowledge in?
These indicators, which are self-reported, reflect whether learners feel prepared and motivated to act.
4. Completion Vs. Comprehension
Many businesses track course completion rates, but completion does not imply understanding. A learner may complete all modules without understanding the ideas. Learning outcome metrics delve deeper, by asking the following questions-
- Can learners express what they have learned?
- Can they overcome challenges with their newly acquired knowledge?
- Can they make educated decisions based on their training?
This transition from completion to comprehension is critical for effective L&D evaluation.
Feedback & Satisfaction Metrics: Understanding the Learner Experience
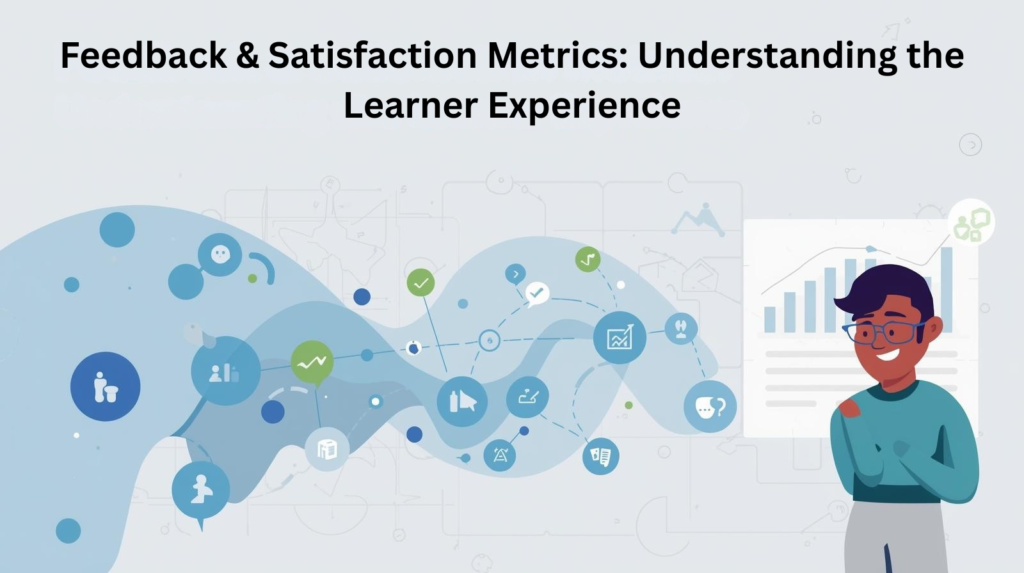
While engagement & learning outcomes demonstrate what occurred during an L&D event, feedback and satisfaction metrics provide insight into how learners felt about the experience. These metrics emphasize perception, relevance and emotional response, all of which have a significant impact on whether learners remain motivated and apply what they’ve learned later.
Learning is more than just a rational process; it is fundamentally human. Even the best-designed content will be ineffective if learners perceive the session to be uninteresting, irrelevant, or incomprehensible. That is why feedback metrics are so important in determining L&D event success.
Feedback enables L&D teams to address crucial issues like-
- Did the learner believe the subject was applicable to their real-world jobs?
- Was the delivery interesting & easy to understand?
- Did the learning format meet their needs?
- Would they like to attend such sessions again?
When learners feel heard, they are more inclined to trust the learning and development function and actively participate in future programs. Consistent feedback analysis gradually enhances both learning design and learner confidence.
1. Post-Event Surveys and Satisfaction Scores
The post-event survey is one of the most typical ways to collect feedback. These surveys typically measure-
- Overall satisfaction with the event.
- Content relevance.
- Speaker’s efficacy.
- Session pace and clarity.
- Easy to use the virtual platform.
Although satisfaction does not show that learning occurred, it does serve as an early signal of future success. Learners who rate sessions highly are more inclined to review materials, reflect on lessons, and try out new skills.
2. Net Promoter Score (NPS) for L&D Events
The Net Promoter Score (NPS) asks a simple yet powerful question like “How likely are you to recommend this educational event to a colleague?”
This metric measures the learners overall emotional response to the experience of the event. A high NPS indicates that learners derived actual value from the event, and would advocate for it internally.
Tracking NPS trends over time assists L&D teams in understanding whether their programs are becoming more relevant, or losing relevance.
3. Qualitative Feedback and Open-Ended Responses
Open-ended feedback explains why, while numbers just convey half of the tale. Comments like-
- “I wish we had more real-life examples”.
- “The breakout rooms helped me understand better”.
- “The session felt rushed”.
These comments identify unique strengths and deficiencies that quantitative metrics may overlook. When studied systematically, qualitative feedback becomes one of the most effective tools for continual improvement in learning and development.
Behavior Change Metrics: Measuring Learning in Action
Learning takes on meaning when it leads to behavior change. This is the point at which knowledge is transferred from the training room to the workplace. Modern learning and development theory holds that if behavior does not change, learning has not occurred.
Attendance and engagement are leading indicators, but behavior change is the primary measure of true L&D impact.
L&D events aim to affect how people-
- Communicate.
- Make decisions.
- Solve difficulties.
- Lead teams.
- Perform tasks.
If employees return to work and behave just as before, the training has failed, regardless of how many individuals attended.
1. Manager Observations and Supervisor Feedback
Managers have an important role in spotting behavioral changes. They can observe-
- Improved communication style.
- Better teamwork.
- Improved confidence in decision-making.
- Increased productivity at work.
Structured management feedback collected weeks or months following the event gives good evidence of whether learning is being put into practice or not.
2. Self-Reported Behavior Change
Follow-up questionnaires or check-ins allow learners to reflect on their own behavior changes. Questions might include-
- What new behaviors have you implemented since the event?
- What worked best?
- What challenges did you encounter?
While self-reported data has limits, it can provide useful information about learner purpose & effort, particularly when paired with other indicators.
3. 360-Degree Feedback and Peer Input
360-degree feedback provides depth by gathering perspectives from peers, direct subordinates and managers. This method removes prejudice, and provides a more full picture of how behavior has evolved over interactions.
Behavior change measurements are critical because they bridge the gap between learning and performance. Without them, the impact of learning and development remains theoretical.
Business Impact Metrics: Connecting L&D Events to Organizational Outcomes
To gain trust at the leadership level, L&D must link learning outcomes to business results. Business impact metrics demonstrate how training helps organizations achieve their goals and strategic aspirations.
Executives care about productivity, revenue, quality, efficiency and retention. When learning and development events can be linked to advances in these areas, training becomes a strategic investment rather than a cost center.
1. Performance Improvement Metrics
Depending on the event’s goal, performance metrics could include-
- Sales performance following product training.
- Reduced error rates following compliance training.
- Faster onboarding after new hire programs.
- Improved customer satisfaction following service training.
These indicators show whether learning initiatives influenced actual business outcomes or not.
2. Employee Retention and Career Growth
High-quality learning experiences boost employee morale, and career confidence. Organizations frequently see-
- Increased retention among trained personnel.
- Increased internal promotions.
- Strengthened leadership pipelines.
Tracking retention and mobility among L&D participants demonstrates long-term corporate value.
3. Return on Investment (ROI)
ROI measures the financial advantages of training against its expense. While not often straightforward to assess, virtual L&D events frequently demonstrate high ROI due to-
- Reduced travel and venue costs.
- Scalable delivery.
- Reusable content.
Platforms such as Airmeet enable enterprises to deliver high-impact learning while reducing expenses; making ROI evaluation more attractive & realistic.
Community and Networking Metrics in Virtual L&D Events

Learning is fundamentally social. People frequently learn best by sharing their ideas, experiences and challenges with others. In virtual L&D events, community & networking metrics show how well the learning environment facilitates collaboration.
When learners connect with peers-
- Knowledge becomes contextual.
- Learning feels more relevant.
- Motivation grows.
- Retention improves.
A vibrant learning community broadens the influence of an event beyond the scheduled sessions.
1. Networking Participation Metrics
In virtual events, networking metrics could include-
- Number of peer connections created.
- Participation in breakout conversations.
- Engagement in networking lounges.
- Post-event community activities.
These indicators indicate if learners are developing partnerships that promote continuing learning or not.
2. Post-Event Community Engagement
What happens following an L&D event can also be used to determine its success like-
- Continued conversations.
- Shared resources.
- Peer problem solving.
- Follow-up collaboration.
Platforms such as Airmeet facilitate structured networking and community interactions, transforming one-time events into continuing learning environments.
Technology and Platform Metrics: Measuring the Learning Experience Itself
Technology is key to virtual learning and development success. Even the best content can fail if the platform experience is irritating or untrustworthy.
Technology metrics can address queries such as-
- Did learners struggle with access or navigation?
- Were the engagement tools straightforward to use?
- Did technical difficulties impede learning?
A frictionless experience allows learners to focus on content rather than troubleshooting.
1. Platform Usage and Feature Adoption
Tracking how learners use platform features reveals what improves learning. Metrics can include-
- Use of chat, polling, and Q&A.
- Participation in breakout rooms.
- Viewing the session recordings.
- Engagement with downloaded resources.
High adoption suggests that the platform efficiently promotes learning.
2. Technical Performance and Support Metrics
Important technical indications are-
- Drop-off due to technical concerns.
- Support Requests.
- Session Stability.
Monitoring these KPIs enables L&D teams to improve future event delivery and learner satisfaction.
How Virtual Event Platforms Like Airmeet Make Measurement Easier
Virtual event platforms are no longer just video conferencing tools; they are powerful measurement engines. Airmeet, for example, is designed to help L&D teams track important data without the need for manual labor. Here’s how Airmeet makes measurement easier & more efficient-
1. Built-in Analytics Dashboard
Airmeet offers real-time and post-event information, including attendance behavior, engagement levels, session duration and drop-off points. This eliminates the requirement for several extra tools.
2. Detailed Engagement Tracking
Every interaction—poll responses, chat messages, Q&A participation, and networking activity—is automatically logged, providing an accurate picture of learner involvement.
3. Session-Level Performance Insights
Airmeet allows you to examine individual sessions to see which topics, presenters, or formats worked best and which require improvement.
4. Networking and Community Metrics
Airmeet, unlike conventional webinar solutions, tracks networking engagement, contacts created & social interactions to assist measure the impact of collaborative learning.
5. Easy Feedback Collection
Post-event surveys & feedback may be seamlessly incorporated; making it easy to measure learner sentiment, and satisfaction at scale.
Conclusion
Measuring L&D event success beyond attendance is no longer optional, but it’s required. Attendance reveals who showed up. Meaningful metrics tell you what has changed.
By focusing on engagement, learning outcomes, behavior change, and business impact, L&D leaders can-
- Demonstrate the usefulness of their programs.
- Continuously improve your learning experiences.
- Align training with the organizational goals.
- Create a culture of measurable growth.
In a virtual-first world, success goes to firms that assess what genuinely counts.
The most effective learning and development teams do not track KPIs in isolation. They build integrated dashboards that include engagement data, learning outcomes, feedback, behavioral change, and business impact.
This comprehensive perspective enables stakeholders to comprehend not just what occurred, but also why it is significant.
Frequently asked questions
Aside from attendance, the most significant indicators for measuring L&D event effectiveness are-
- Learner engagement.
- Learning outcome.
- Behavior changes.
- Business impact.
These indicators assist organizations in determining if learners actively participated, acquired knowledge, utilized skills at work & contributed to company goals. Measuring beyond attendance ensures that L&D activities provide genuine value, not simply participation numbers.
Airmeet helps monitor the performance of L&D events by offering granular insights on engagement, participation, session behavior, and attendee interaction. These insights enable L&D teams to measure metrics other than attendance, evaluate learning efficacy, improve learner experience, and link training outcomes to business success in a scalable and data-driven manner.
Attendance is an unreliable indicator because it simply indicates who attended an L&D event, not who learnt or applied the knowledge. Employees may attend a training session without paying attention or participating. Metrics other than attendance, including engagement, learning retention, and behavior change, provide more information into whether training activities enhance performance and skills of the employee or not.